Introduction
Suppose you have a distributed application running in production and it is based on Micro services/Service Oriented Architecture and have SLA of being “always on” (be available 24*7, barring deployments of course !!). In such cases, having proper monitoring of Application health in place is absolutely essential.
What if Monitoring is an afterthought (i.e. application is already in production) ? and that there is little apetite for additional components like (Visualization tools, specialized storage for logs/metrics/traces) for monitoring?
Is it even possible to have near real time Monitoring of Application’s behaviour using already-in-use technologies (like PostgreSQL) ?
Monitoring and more generically, “Observability” has three pillars. They are Logs, Metrics and traces. Many of the existing applications are producing either (mostly logs or traces) but seldom all. Hence, it is necessary to use existing logs/traces as basis for Metrics generation.
There are on-going developments With standards like Opentelemetry in this field. Some have even suggested ( here & here) that traces (distributed) will eventually replace logging.
Approach
The high level architecture looks like below,
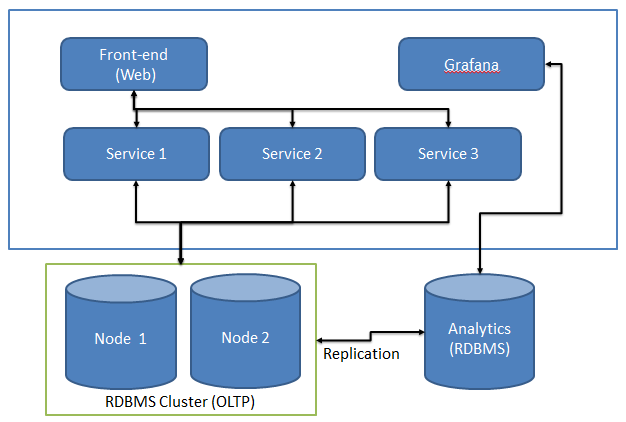
Considering as-is state of Application Architecture and given the constraints (mentioned earlier), this post covers approach that is based upon,
- PostgreSQL - Data store for Analytics and Reporting
- TimescaleDB - Timescale plugin for PostgreSQL
- FluentBit - Processing of Web Server logs & forwarding to database
- Grafana - Data Visualization and Monitoring platform.
Lets see how to get this done step by step.
Data Collection and Storage
TimescaleDB
Timescale is a Postgresql Plugin for time-series data management.
Rationale
- The reports and dashboards expected for near real time API monitoring are time intensive in nature.
- TimescaleDB is optimized for such time intensive reporting and suits well for this use case as it is a plugin over PostgreSQL, which is already being used for analytics/reporting.
Installation of plugin is straightforward. Step by Step tutorial is very helpful.
Next step is to create a database for the data to be used for Monitoring. Hyper table(s) in this database will contain Metrics data, collected from Application and web server (IIS).
One of the required dashboard/report was to monitor API request(s) in terms of success & failure (%), Response times (in buckets like 1-5 secs,5-10 secs and so on).
For each API request, application collects specific details and persists it in database. Currently below attributes are stored in database as part of each log entry,
| Attribute | Description |
|---|---|
| Time | Timestamp of event |
| Service | Attribute indicating service name |
| Operation | Attribute indicating Operation of the service for which request was received |
| Outcome | Outcome of the API Invocation i.e. Success or Failure |
| Timeout | Timestamp of completion of API invocation |
The DDL command will look like,
create table apilog
(time    timestamptz  not null,
 service  text not null,
 operation  text,
 outcome  text not null,
 timeout  timestamptz );
After creating the table, it will have to be converted into Hypertable by using command,
SELECT create_hypertable('apilog', 'time');
Note: Timescale transparently manages storage for hyper table and PostgreSQL Developer can continue to use standard SQL/plpgsql with it.
For the sake of quick testing, One can add dummy data to this table using below SQL,
insert into apilog
SELECT (current_timestamp - '0 day'::interval), (case when x = 1 then 'finance'
                                  else 'it' end),(case when x = 1 then 'getPrices'
                                  else 'getUptime' end),  (case when x < 2 then 'success' else 'failure' end),   (current_timestamp - '0 day'::interval) + trunc(random()  * 20) * '1 second'::interval FROM generate_series(0, 5000, 5) AS t(x);
Currently, Application generates log events in OLTP Database and data from this database is replicated to Reporting database. Since we have created new Hyper table to host this data,a simple approach of Trigger can be used to populate it from current table.
In real scenario, you may want to consider replicating the data directly to hyper table.
FluentBit
So far , we have collected Application logs in the database. There is one more source which is of importance in the context of Monitoring and that is infrastructure software. It could be Operating System, Web Servers and so on. They generate lot of logs and metrices that can be ingested and consumed in conjuction with Application log to get better picture. We will look at how Web server logs can be sourced in data source.
There are many monitoring tools (refer Useful links below for comparison) available with focus on IT and Network monitoring. Such tools readily include infrastructure software too. For the sake of this article, We can use Log collector tool for this purpose. As such there are many log collector tools available, we will use Fluentbit.At a very High level, It has concepts of,
- Input - Log sources
- Parsers - Plugins to parse & transform the logs
- Output - Log Destination like Prometheus, Kafka, PostgreSQL and so on.
Some of the advantages of Fluentbit are,
- High log delivery performance with efficient resource utilization
- Robut and Lightweight approach
- Log enrichment at Node level itself than on the destination
- Simpler configuration format
Setup FluentBit - Fluentbit provides binaries that are bundled with package managers in case of Linux and as installers for Windows.
As of writing of this post, Pre-built binaries do not include output plugin for PostgreSQL. So Fluentbit has to be built from source after modifying Cmakelist so,
Clone the github repository
Modify
CMakeLists.txtfile as below,option(FLB_OUT_PGSQL "Enable PostgreSQL output plugin" No)to
option(FLB_OUT_PGSQL "Enable PostgreSQL output plugin" Yes)Refer to Compiling from Source for further details.
Configuration - Once fluentbit is installed, It needs to be configured to read Web server logs , parse them and push them to PostgreSQL.
Below is sample configuration to periodically read Web Server Logs (in w3c log format), parse and push them to PostgreSQL,
[SERVICE]
    Flush        5
    Daemon       Off
    Log_Level    debug
    Log_File     d:\monitoring\fluentbit.log
    Parsers_File parsers.conf
    Parsers_File generated/parsers_generated.conf
    HTTP_Server  On
    HTTP_Listen  0.0.0.0
    HTTP_Port    2020

[INPUT]
    Name           tail
    Tag            format.iis
    Parser         dips-w3c
    path           d:\temp\iis.log
    DB             d:\temp\raw.iis.db


[OUTPUT]
    Name          pgsql
    Match         *
    Host          172.0.0.1
    Port          5432
    User          fluentbit
    Password      fluentbit
    Database      timescalepoc
    Table         iislogs
    Timestamp_Key time
Configuration for Parser is as below,
[PARSER]
    Name           dips-w3c
    Format         regex
    Regex         ^(?<time>\d{4}-\d{2}-\d{2} \d{2}[\:\.]\d{2}[\:\.]\d{2}) (?<serverip>\S+) (?<method>\S+) (?<uristem>\S+) (?<uriquery>\S+) (?<serverport>\S+) (?<username>\S+) (?<clientip>\S+) (?<userAgent>\S+) (?<referrer>\S+) (?<status>\S+) (?<substatus>\S+) (?<win32status>\S+) (?<timetaken>\S+) (?<useragent1>\S+) (?<auth>\S+) (?<contenttype>\S+)
    Time_Key       time
    Time_Format    %F %T
    Time_Keep      True
    types          serverPort:integer httpStatus:integer httpSubStatus:integer win32Status:integer timetaken:integer
This parser basically uses Regular Expression to parse each line in log file into key - value pairs with data points of interest.
In terms of output, Fluentbit’s Postgresql plugin provisions the table itself with a structure that stores entire JSON in field as part of row. Either this table can be used as is or use “Before insert” trigger as suggested by Fluentbit’s manual to parse the Json and populate separate table.
Fluentbit can be easily configured to run as daemon (on Linux) or Service (on windows).
Visualization
With data getting added to timescaledb Hyper table,Lets see how it can be visualized.
Typically, there are 2 approaches to be considered for Visualization,
Custom-built Web UI - This only makes sense if,
- There is already a Reporting/Visualization Web UI in place and adding new dashboards/reports is not much pain
- Not much customization and/or slicing-dicing is expected.
- Limited Efforts available.
Off the shelf Tools - This approach makes sense if,
It is expected that Monitoring dashboards should be flexible and provide ease of customization by business or power users.
Additional dashboards are expected or can be provisioned with minimal or no coding.
There are many paid and open source tools available. Notable OSS options are,
- Grafana - Tailor made for Monitoring and extensive analysis of Time series data.
- Apache Superset - open-source application for data exploration and data visualization able to handle data at petabyte scale.
Lets see how Grafana can be used for visualization (Probably, i may evaluate superset some time and update this post.)
Grafana
Grafana has multiple offerings and one of them being Open source, Self-hosted Application. It has Go backend and is very easy to install. For Windows, Just follow the steps at Installation.
Once grafana is setup, one can quickly start it by running grafana-server. By default, it starts Web server at port 3000. With Grafana Web-based GUI up and running, lets perform below steps to get dashboard in place.
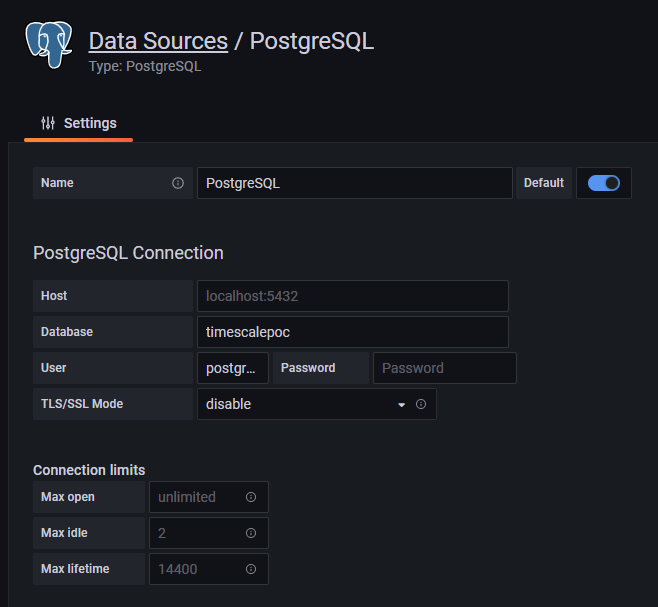
- Connectivity to PostgreSQL - One needs to add Data Source in Grafana which in this case is PostgreSQL Database. It can be added from sidebar on Grafana UI, by hovering over “Configuration” option. In below screenshot, it shows configuration.
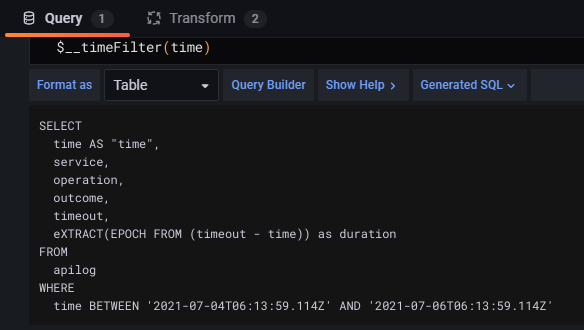
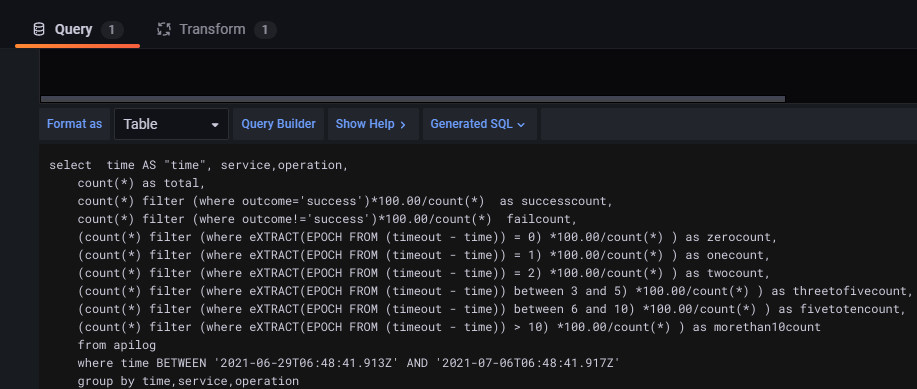
- Add Dashboard - Once the Data source is setup, next step is to add a dashboard. Dashboard essentially is a visualization or a report. It has Query (in this case SQL Query) to fetch the data. Below screenshot shows configuration of simple query for Dashboard,
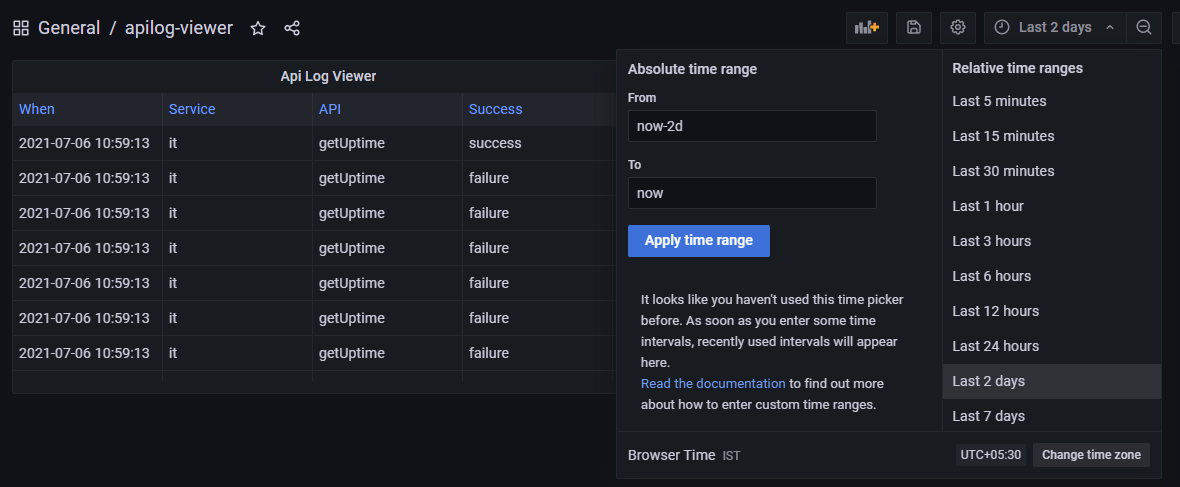
Grafana requires certain functions to be included (like $__time(..) and $__timeFilter(..)) in query so as to facilitate filtering/ordering by user through UI, like shown below,
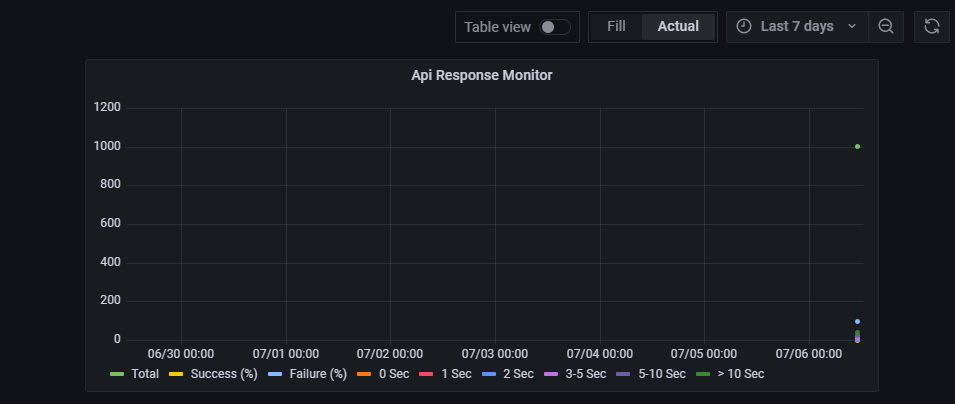
Grafana provides extensive ways to transform on the data fetched by SQL Query. This feature is more aimed at business and power user who may want to perform additional analysis on it. Alternative is to provide desired SQL and get the visualization like Time series or Graph as shown below,
Note that there are many more features provided by Grafana (in terms of transformations, Visualization options, Access Control to UI itself and so on.
Key points with this approach are,
- Leveraging tools/products currently in use.
- Greater Flexibility in Visualization over custom built tool containing canned reports/graphs
- Lesser learning curve than inducting new tools.
This post barely touches surface of what each of the individual tools mentioned have on offer, one would do well to go through their documentation to derive most value out of it.
Useful links (#usefullinks)
Happy Coding !!