Background
How many times have we landed up in a meeting staring at random slowness or such production issues in a distributed Application ? only to experience helplessness with limited (or often times no) visibility available about the runtime behavior of the Application. It often ends up in manually correlating whatever diagnostic data available from Application and combining it with trace/logs that are available from O/S, databases etc. and trying to figure out “Root cause” of the issue.
Today’s mission critical, distributed applications and systems make it even more important to observe them, be it serving web requests, processing stream of data or handling events. The scale at which these applications/systems operate at, often hundreds or thousands of requests, requires watching how well system is working, instead of waiting for failure or doing analysis post failure.
In distributed systems, telemetry can be divided into three overarching flavors:
- (Distributed) Traces: detailed records of the paths that distinct requests take as they propagate across an entire system (including across service boundaries)
- Metrics: aggregate statistics (mostly counters and gauges) about processes and infrastructure, typically with key:value tags attached to disaggregate patterns
- Logs: timestamped messages – sometimes structured – emitted by services or other components (though, unlike traces, not necessarily associated with any particular user request or transaction)
To this effect, Cloud Native Computing Foundation (CNCF) has been working on Opentelemetry.
What is OpenTelemetry?
OpenTelemetry is a vendor-neutral standard for collecting telemetry data for applications, their supporting infrastructures, and services.
For deep dive, history etc., refer to Overview here.
So is this standard already available? As of this writing, it is about to go GA soon. This makes it more important to be aware of its scope (subjected to change). Let’s see how it is proposing to address/implement Observability.
Below diagram depicts what OpenTelemetry does in Nutshell (Source: Opentelemetry.io),

The general process of using OpenTelemetry is,
- Instrumentation of Application Code (including libraries)
- Validate Instrumentation by sending it to Collector like Jaeger (For simplicity, we will only be using Console exporter)
- Learn how Instrumentation helps in correlating, watching runtime behavior
While vendors, having back-end systems, are providing or working on integrations with OpenTelemetry. The OpenTelemetry team has provided client libraries for Instrumentation in Go, .NET, Java,JavaScript, Python (and more coming). So lets us see what these libraries offer as of today by implementing .NET library.
In this post, We will look at how Opentelemetry helps us with “Distributed tracing”.
OpenTelemetry for .NET
.NET client of OpenTelemetry supports both .NET Framework as well as .NET Core.
For list of available instrumentation libraries and exporters, refer here
In the below sections, We will try to simulate a scenario, which is typical in Microservices style of Architecture, where service invokes another service using HTTP. Now, aim is to verify how using OpenTelemetry will help in watching traffic between these two services.

Lets start,
Create Web Service (I am using .NET Core SDK 3.1.300 on Windows)
Use
dotnet new webapito scaffold a REST APIAdd references to below packages using Nuget,
OpenTelemetry.Exporter.Console- Exporter package to output telemetry to ConsoleOpenTelemetry.Instrumentation.AspNetCore- Package that transparently instruments ASP.NET Core request processing pipelineOpenTelemetry.Instrumentation.Http- Package that transparently instruments HTTP Communication.
Startup.cs- It configures OpenTelemetry instrumentation with Console Exporter and instrumentation for HTTP requests. Below is ConfigServices function of Startup class.public void ConfigureServices(IServiceCollection services) { services.AddOpenTelemetryTracing( (builder) => builder.AddAspNetCoreInstrumentation(opt => opt.Enrich = (activity, eventName, rawObject) => { if (eventName.Equals("OnStartActivity")) { if (rawObject is HttpRequest httpRequest) { activity.SetTag("requestProtocol", httpRequest.Protocol); } } else if (eventName.Equals("OnStopActivity")) { if (rawObject is HttpResponse httpResponse) { activity.SetTag("responseLength", httpResponse.ContentLength); } } }) .AddHttpClientInstrumentation() .AddConsoleExporter() //opt => opt.DisplayAsJson = true) ); }WeatherForecastController.cs- This is default controller added bydotnet new webapicommand. We will addGETendpoint to simulate a dummy HTTP Request. This is to verify telemetry produced for the same.[HttpGet("{key}")] public async Task<IEnumerable<WeatherForecast>> Get(string key) { // Making an http call here to serve as an example of // how dependency calls will be captured and treated // automatically as child of incoming request. var res = await httpClient.GetStringAsync(string.Format("https://www.google.com/search?q={0}", key)); var rng = new Random(); return Enumerable.Range(1, 5).Select(index => new WeatherForecast { Date = DateTime.Now.AddDays(index), TemperatureC = rng.Next(-20, 55), Summary = Summaries[rng.Next(Summaries.Length)], }) .ToArray(); }
Lets create a Service 1 For the sake of simplicity, we will have “Service 1” implemented as Console Application,
Use
dotnet new consoleto create new App.Add reference to “OpenTelemetry.Exporter.Console” using
dotnet add OpenTelemetry.Exporter.Console -version 0.7.0-beta.1. This package is specifically meant for exporting telemetry to Console. There are other exporters available to export to Jaegar, Zipkin etc. but this is simplest one to setup.Add reference to “OpenTelemetry.Instrumentation.Http” using
dotnet add OpenTelemetry.Instrumentation.Http -version 0.7.0-beta.1. This package helps in instrumenting HTTP requests.Add below code to
program.cs,static async Task Main(string[] args) { // Configure OpenTelemetry Tracer with Console exported and initiate it Sdk.CreateTracerProviderBuilder() .AddHttpClientInstrumentation() .AddConsoleExporter() .Build();
          try
          {
              // Simulate HTTP Request to our service
              string responseBody = await client.GetStringAsync("https://localhost:5001/weatherforecast/abc");

              Console.WriteLine(responseBody);

          }
          catch (HttpRequestException e)
          {
              Console.WriteLine("\nException Caught!");
              Console.WriteLine("Message :{0} ", e.Message);
          }

          Console.WriteLine("Done!");
      }
In this class, we have configured OpenTelemetry tracer with Console Exported and intialized it. Further, HTTP requests are automatically instrumented since we have added
OpenTelemetry.Instrumentation.Httppackage.Observe the Telemetry,
- Start the Web Service. Check that it is listening on port
8080by visitinghttps://localhost:8080. Note: you may have to install Client certificate to enable SSL. - Start the Console Application. This application will send HTTP request to the service.
- Observe the telemetry produced by,
Console Application,
Default Telemetry generated - Activity Id (GUID) is generated for a Span (Refer here for details on what span means)
- It also records start and end time
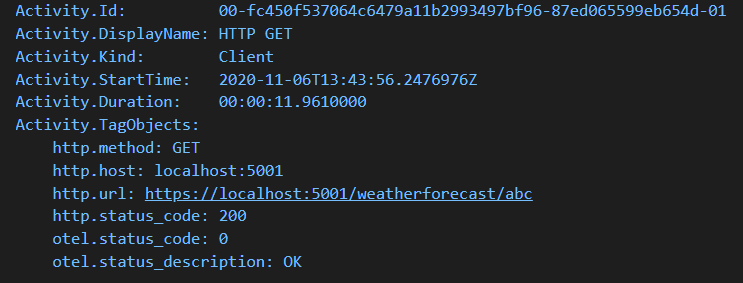
Web Service,

Default Telemetry Observations
- Check Activity ID being shown is same as one reported by Console Application. So correlation has been established across process boundaries. This is important when tracing end to end across processes. This is achieved by means of passing Activity ID as HTTP Header. In a Visualization tool, this correlation is used to depict end to end flow with time at each step.
- By default, it logs start and end time. For any HTTP request, it generates additional telemetry covering URL to which request was sent and start and end time.
- Start the Web Service. Check that it is listening on port
In Summary, this default telemetry can obviously be enhanced by adding Tags. When coupled with additional telemetry in the form of metering (to statistically observe behavior of high traffic, large scale system) and telemetry from Infrastructure (i.e. OS) and other Systems (e.g. Databases), it truly provides complete view of proceedings end to end.
Hope this provides overview of instrumentation as provided by OpenTelemetry. Let me know if you have any questions or suggestions in Comments section below.
Instrumenting .NET framework based Apps for same scenario is similar to above, refer folder Opentelemetry in repository here
Useful References,
Happy Coding !!