Introduction
We develop a piece of software with aim to fulfil specific business requirements in terms of resource usage, throughput, availability among others. Profiling and benchmarking are approaches that developer has in his/her arsenal to gain continuous feedback on whether a piece of code is behaving optimally and adhering to it’s objectives.
Lets look at what they mean,
- Profiling is defined as process
aimed at understanding the behavior of a program. A profile result might be a table of time taken per function,as per this and this) - Benchmarking
measures the time for some whole operation. e.g. I/O operations per second under some workload. So the result is typically a single number, in either seconds or operations per second. Or a data set with results for different parameters, so you can graph it.. Refer this for more information. Also do check Benchmarking correctly is hard by Julia Evans.
Typically, Profiling is supported by most of the environments (either via IDEs like Visual Studio or through language itself [Like Go] has buil-in provision for the same while Benchmarking is typically performed on dedicated testing infrastructure.
In this article, We will look at couple of tools in this space that can be easily integrated in developer’s workflow so as to get early feedback. Lets’ go.
Profiling
Pyroscope is Open Source Application for profiling Application. It is a cross-language tool i.e. programs in variety of languages can be profiled using it. It works in client server model where in, - Client - Pyroscope executable runs the intended code (in languages like C#, Ruby) etc. (in case of Go, it is available as dependency) and collects instrumentation details to be sent to server. - Server - Runs as a separate process (on Linux [Works in WSL if using Windows] or Mac), collects the data from client processes and renders them as table and/or flame graph via Web UI.A flamegraph is a way to visualize resources used by a program, like CPU usage or memory allocations, and see which parts of your code were responsible.
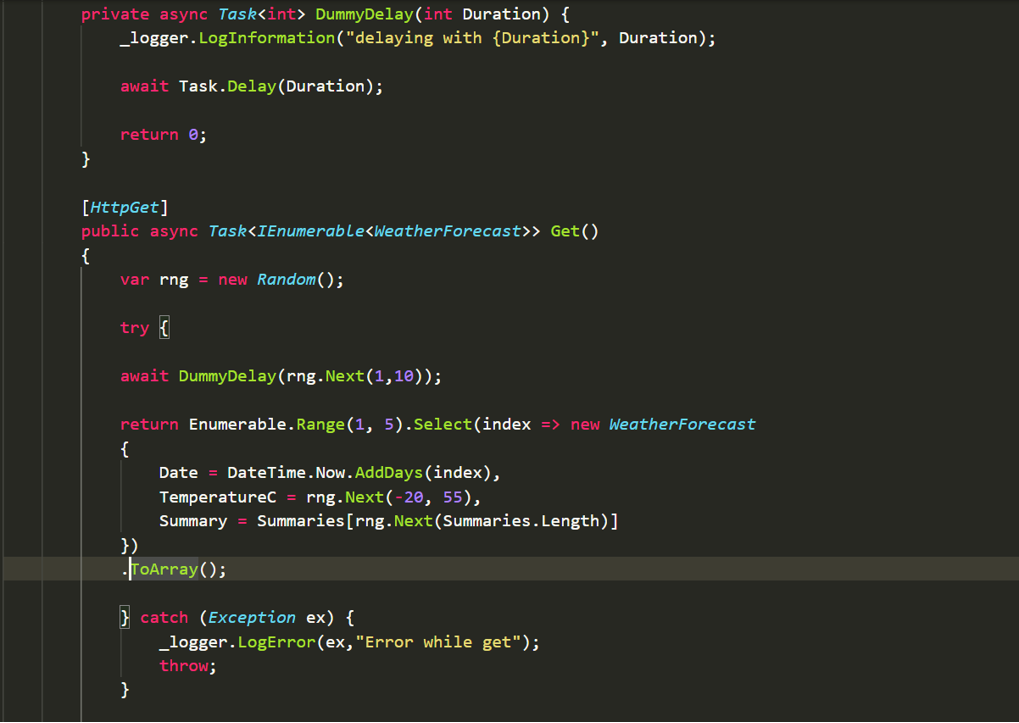
Lets see how a function in C# can be instrumented using PyroScope.
- Develop function to be profiled Lets have ASP.NET Core 5.0 based Web API as below,
Setup Pyroscope
Install Pyroscope Application by following instructions here for Windows. Note that, Pyroscope server component won’t run on Windows in which case either Windows Subsystem for Linux (WSL) or Docker can be used. In case of Linux, instructions provided here are sufficient for both client and server components.
I have setup the application on Windows 10 while using WSL for Pyroscope Server.
Configure Pyroscope client and run the Application
Build the application using
dotnet buildConfigure below environment variables (below is powershell format or you can use
SET ...commands on command prompt),``` $env:PYROSCOPE_SPY_NAME="dotnetspy"; $env:PYROSCOPE_APPLICATION_NAME="my.dotnet.app"; $env:PYROSCOPE_SERVER_ADDRESS="http://localhost:4040"; ```Update path to include pyroscope installation folder using
$env:Path += ";C:\Program Files\Pyroscope\Pyroscope Agent\"Run the Application using
pyroscope exec dotnet .\bin\Debug\net5.0\webapi.dll.
Run Pyroscope Server
Start Pyroscope server from WSL Linux prompt using,
sudo pyroscope server. The output of this command should show Port on which server is running.
Observe the flame graph in Pyroscope Web UI.
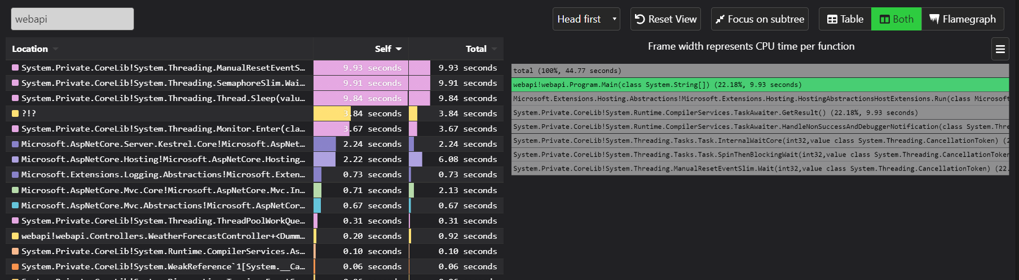
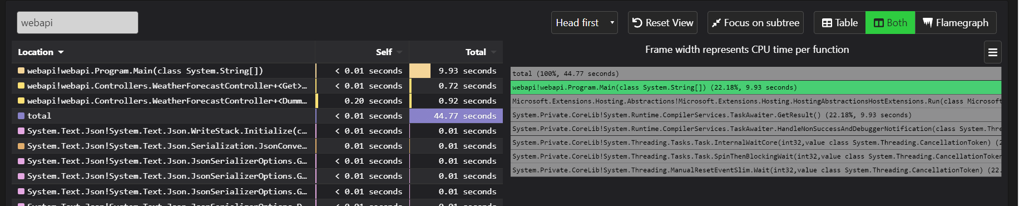
Overall, Pyroscope provides easy way to observe Memory/CPU utilization as part of developer workflow on workstation itself. This is especially useful for development environments which do not provide profiling out of the box.
Benchmarking
Crank is tool used by Microsoft internally to benchmark applications. It is released as Nuget package and currently .NET based code or Docker Containers can be benchmarked using it. Lets see steps to benchmark .NET Application using Crank.
Write code, intended to be benchmarked. In this case, its very simple one as below,
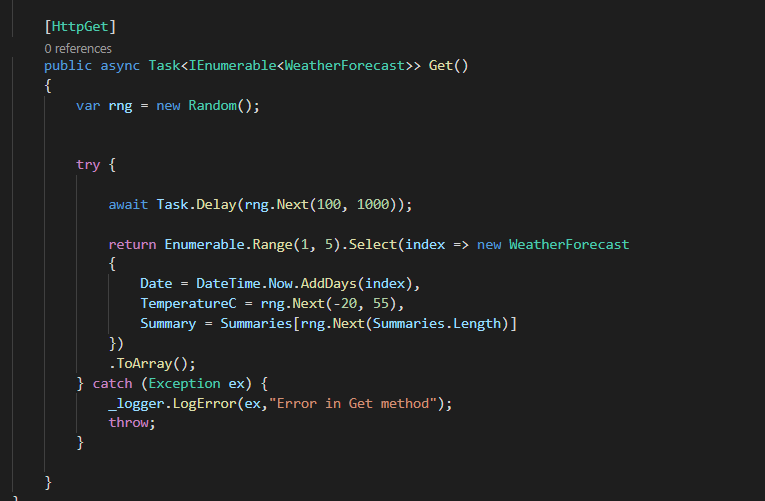
C# Code to be benchmarked Setup Crank
Follow the instructions provided here to setup crank. Crank expects Configuration in YAML format which contains details like Job to be used. Crank has built-in jobs which are essentially wrappers around CLI load testing tools like bombardier and wrk and so on. Since i am using Windows to run crank, we will go with Bombardier which is cross platform. Below is how a basic configuration looks like,
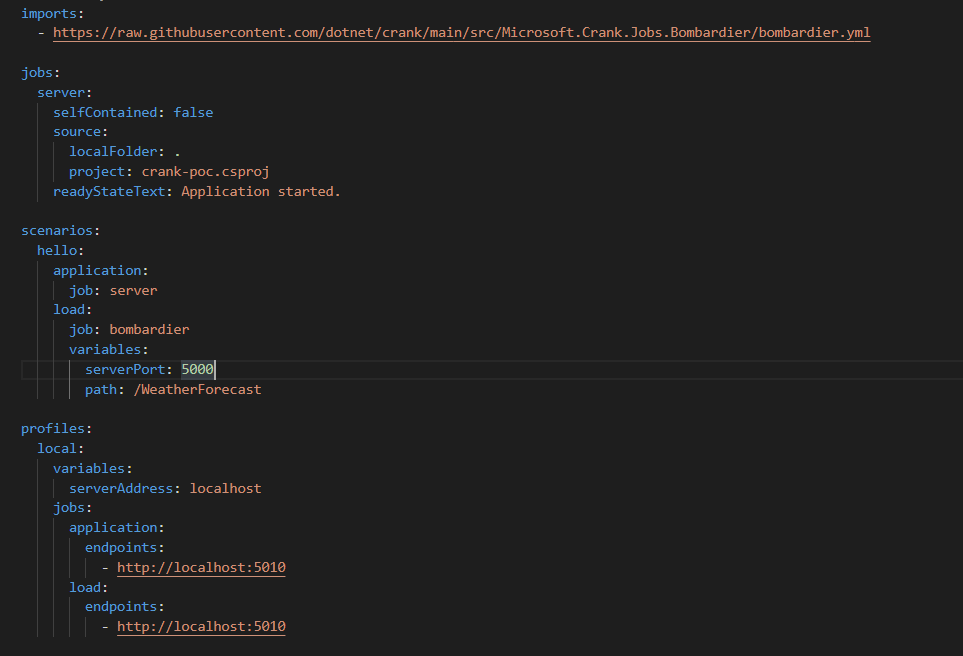
Crank YAML Configuration It allows for extensibility in terms of overriding the job configuration in terms of how load should be generated etc.
Run Crank Agent - Next step is to run crank agent in a command prompt or powershell by simply running
crank-agentRecord data for benchmarking using Crank CLI.
Now run Crank from the application folder as
crank --config crank.benchmarks.yml --scenario hello --profile local --application.options.displayOutput trueThis command builds the code and launches job while recording the Utilization and other parameters and shows output like,
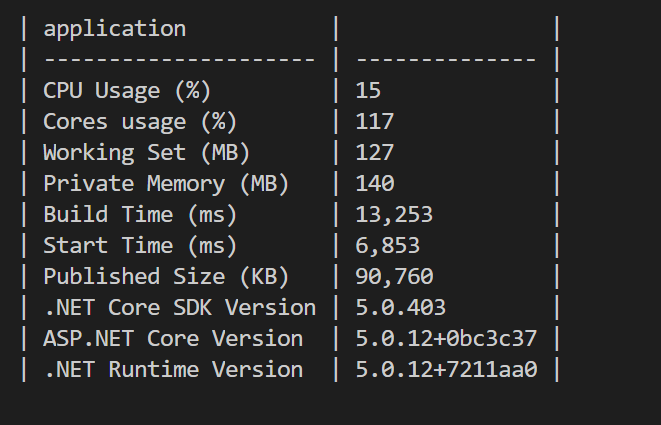
Application's CPU Utilization 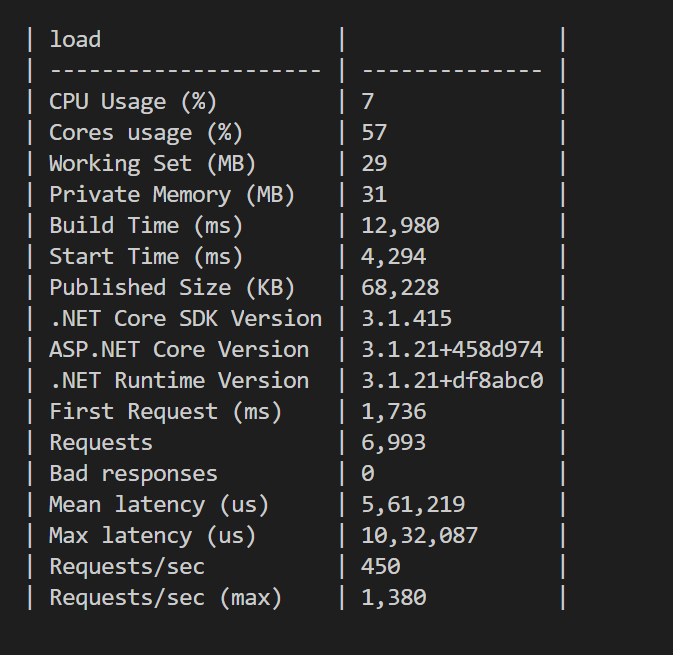
Observations during executing load testing
Overall, i found Crank helpful for following,
- it helps quickly test effect of any code changes by means of quickly benchmarking the application. The overall benchmarking might not be similar to end state ie. when the application will be deployed on target infrastructure. However, it still gives insights to developer about impact of code changes
- Crank can be easily used for local applications as well as for docker containers.
- It can either be used locally or in distributed manner.
Useful References
Happy Profiling and Benchmarking !!